
Compare Solana Tokens with Solscan Token Compare
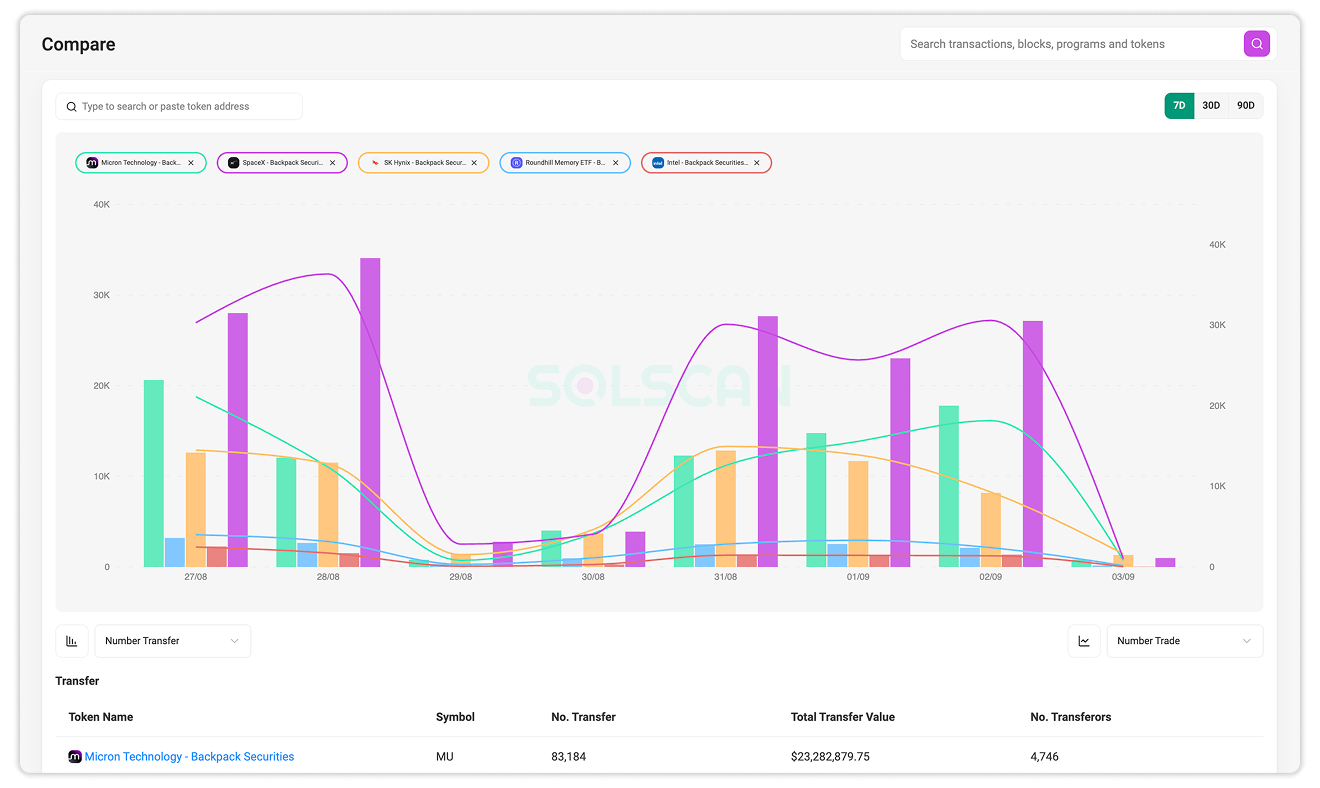
Solscan Token Compare tool brings transfer and DEX trading data for multiple Solana tokens into one view. Users can compare activity over 7-day, 30-day, or 90-day periods using an interactive chart and summary tables.
Instead of opening individual Token Details pages and reviewing each token separately, the tool makes it easier to identify differences in transaction volume, trading activity, and participating addresses.
What Is the Token Compare Tool?
The Token Compare tool compares the on-chain activity of selected Solana tokens over the same period. It can be useful when:
- Comparing tokens within the same sector or category
- Checking whether activity comes primarily from transfers or DEX trading
- Comparing transaction volume with the number of participating addresses
- Reviewing short- and longer-term activity across 7D, 30D, and 90D periods
- Identifying tokens with high activity concentrated among relatively few addresses
The tool is divided into two main components:
- Interactive Comparison Chart: Displays two selected metrics as bars and lines.
- Comparison Tables: Summarize the transfer and DEX trading activity of each token.
The tool compares on-chain activity. It does not assess token legitimacy, reputation, technical quality, or investment performance.
Locate the Token Compare Tool
To access the tool:
- Open the Solscan website.
- Select Leaderboards → Compare from the navigation menu.
You can also bookmark the link at Solscan Token Compare tool directly.
Interactive Comparison Chart
Select Tokens and a Time Range
To begin a comparison:
- Enter a token name or symbol, or paste its token address into the selection field. You can select up to 5 tokens for comparison.
- Choose a 7D, 30D, or 90D time range.
- Select the metrics to display as bars (a) and lines (b).
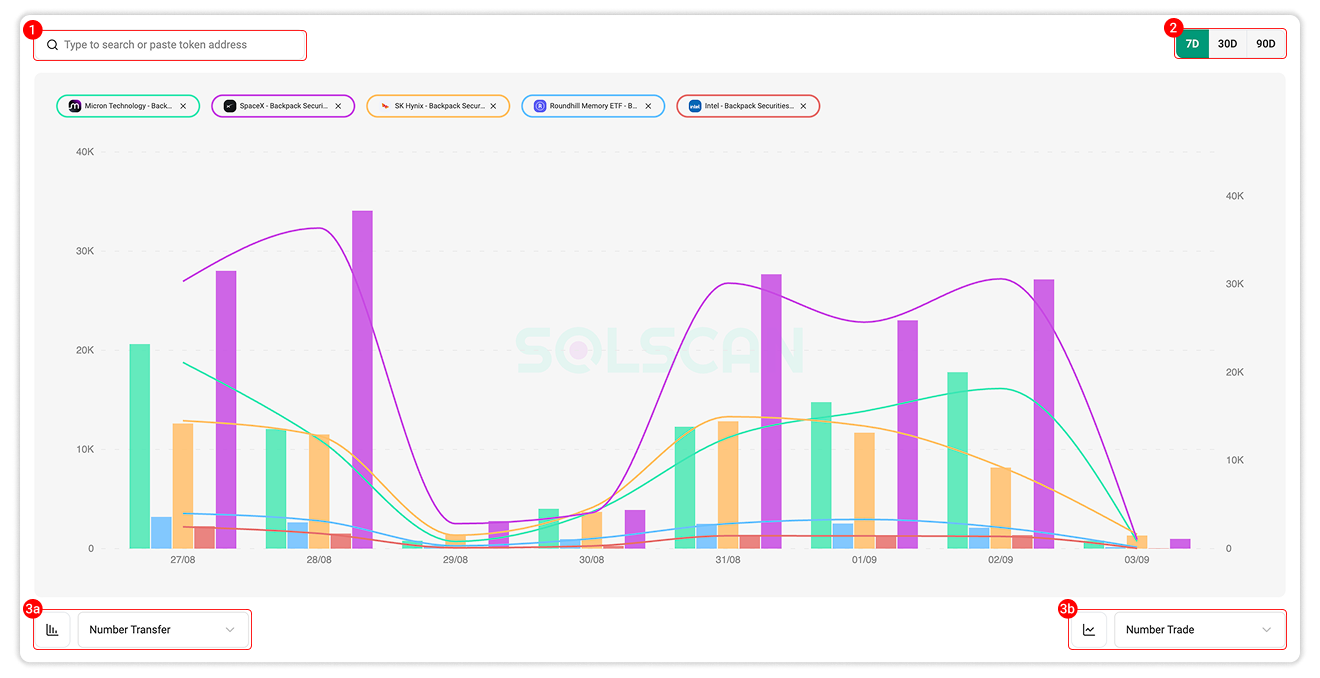
Using a token address is the most precise way to select an asset because different tokens may use similar names or symbols.
Changing the tokens, time range, or metrics automatically updates the chart and tables.
Configure the Bar and Line Metrics
The interactive chart allows users to select one metric for the bars and another for the line. This makes it possible to compare two dimensions of token activity within the same visualization.
For example, displaying Total Trade Value as bars and No. Traders as a line can show whether higher trading value is accompanied by broader trading participation.
The available options are divided between transfer and DEX trading activity.
Transfer Metrics
| Metric | Description |
|---|---|
| Number Transfer | Number of token transfer events recorded during the selected period. |
| Total Transfer Value | Estimated monetary value of the recorded transfers. |
| Total Transfer Amount | Quantity of tokens transferred. |
| No. Transferors | Number of addresses participating in transfer activity. |
| No. Senders | Number of addresses that sent the token. |
| No. Receivers | Number of addresses that received the token. |
DEX Trading Metrics
| Metric | Description |
|---|---|
| Number Trade | Number of DEX trades recorded during the selected period. |
| Total Trade Value | Estimated monetary value of the recorded trades. |
| Total Trade Amount | Quantity of tokens traded. |
| Total Volume Buying | Total buying volume recorded for the token. |
| Total Amount Buying | Quantity of the token bought. |
| Total Amount Selling | Quantity of the token sold. |
| No. Traders | Number of addresses participating in DEX trading activity. |
| No. Buyers | Number of addresses identified on the buying side of trades. |
| No. Sellers | Number of addresses identified on the selling side of trades. |
When reading these metrics, keep the following distinctions in mind:
- Number refers to how many transfer or trade events occurred.
- Amount refers to the quantity of token units moved or traded.
- Value refers to the estimated monetary value of that activity.
- Transferors, traders, buyers, sellers, senders, and receivers refer to participating on-chain addresses rather than verified individual users.
Comparison Tables
Below the interactive chart, the tool provides separate tables for Transfer and DEX Trading activity. These tables offer a fixed summary of the selected tokens and time range.
Transfer
The Transfer table includes:
-
Token Name: The name of the selected token. Select the token to open its Token Details page on Solscan.
-
Symbol: The token’s indexed ticker symbol.
-
No. Transfer: Number of transfer events recorded during the selected period.
-
Total Transfer Value: Estimated monetary value of the token transfers recorded during the selected period.
-
No. Transferors: Number of addresses participating in the token’s transfer activity.
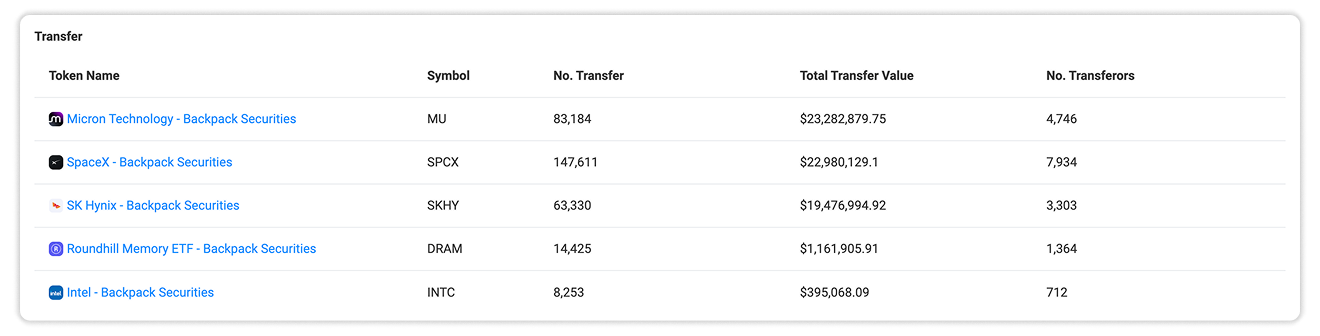
These metrics help distinguish transfer frequency from transfer value and participation. A token may record many transfers with a relatively low total value, or fewer transfers involving a higher combined value.
DEX Trading
The DEX Trading table includes:
-
Token Name: The name of the selected token.
-
Symbol: The token’s indexed ticker symbol.
-
No. Trade: Number of DEX trades recorded during the selected period.
-
Total Trade Value: Estimated monetary value of the recorded DEX trades.
-
No. Traders: Number of addresses participating in the token’s DEX trading activity.
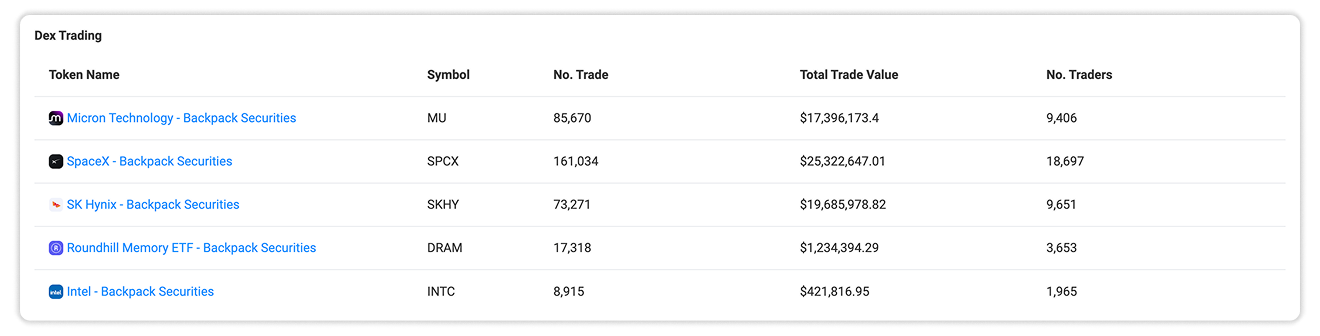
The DEX Trading table helps compare trading frequency, value, and participation. It can also reveal differences between general token movement and activity specifically generated through decentralized markets.
While the tables provide consistent summary metrics, the interactive chart supports a wider selection of data points for more specific comparisons.
Important Considerations
When interpreting the Token Compare results:
- Results depend on the selected period: A comparison over 7D may show a different activity pattern from the 30D or 90D view.
- Verify the token address: Similar names or symbols may refer to different token mints.
- Token amounts are not always directly comparable: Tokens may differ in price, supply, decimals, and unit scale.
- Transfers and trades measure different activity: A token transfer does not necessarily represent a trade, while DEX trading data covers activity processed through decentralized markets.
- Address counts do not equal unique individuals: One person or entity may control multiple addresses, while one address may represent a shared or program-controlled account.
- Activity does not establish legitimacy: Higher transfer or trading activity does not confirm a token’s reputation, security, quality, or investment value.

Still Have Questions?
Supported Explorers
 Solscan
  Eclipsescan
  Fogoscan