Token Analytics on Solscan
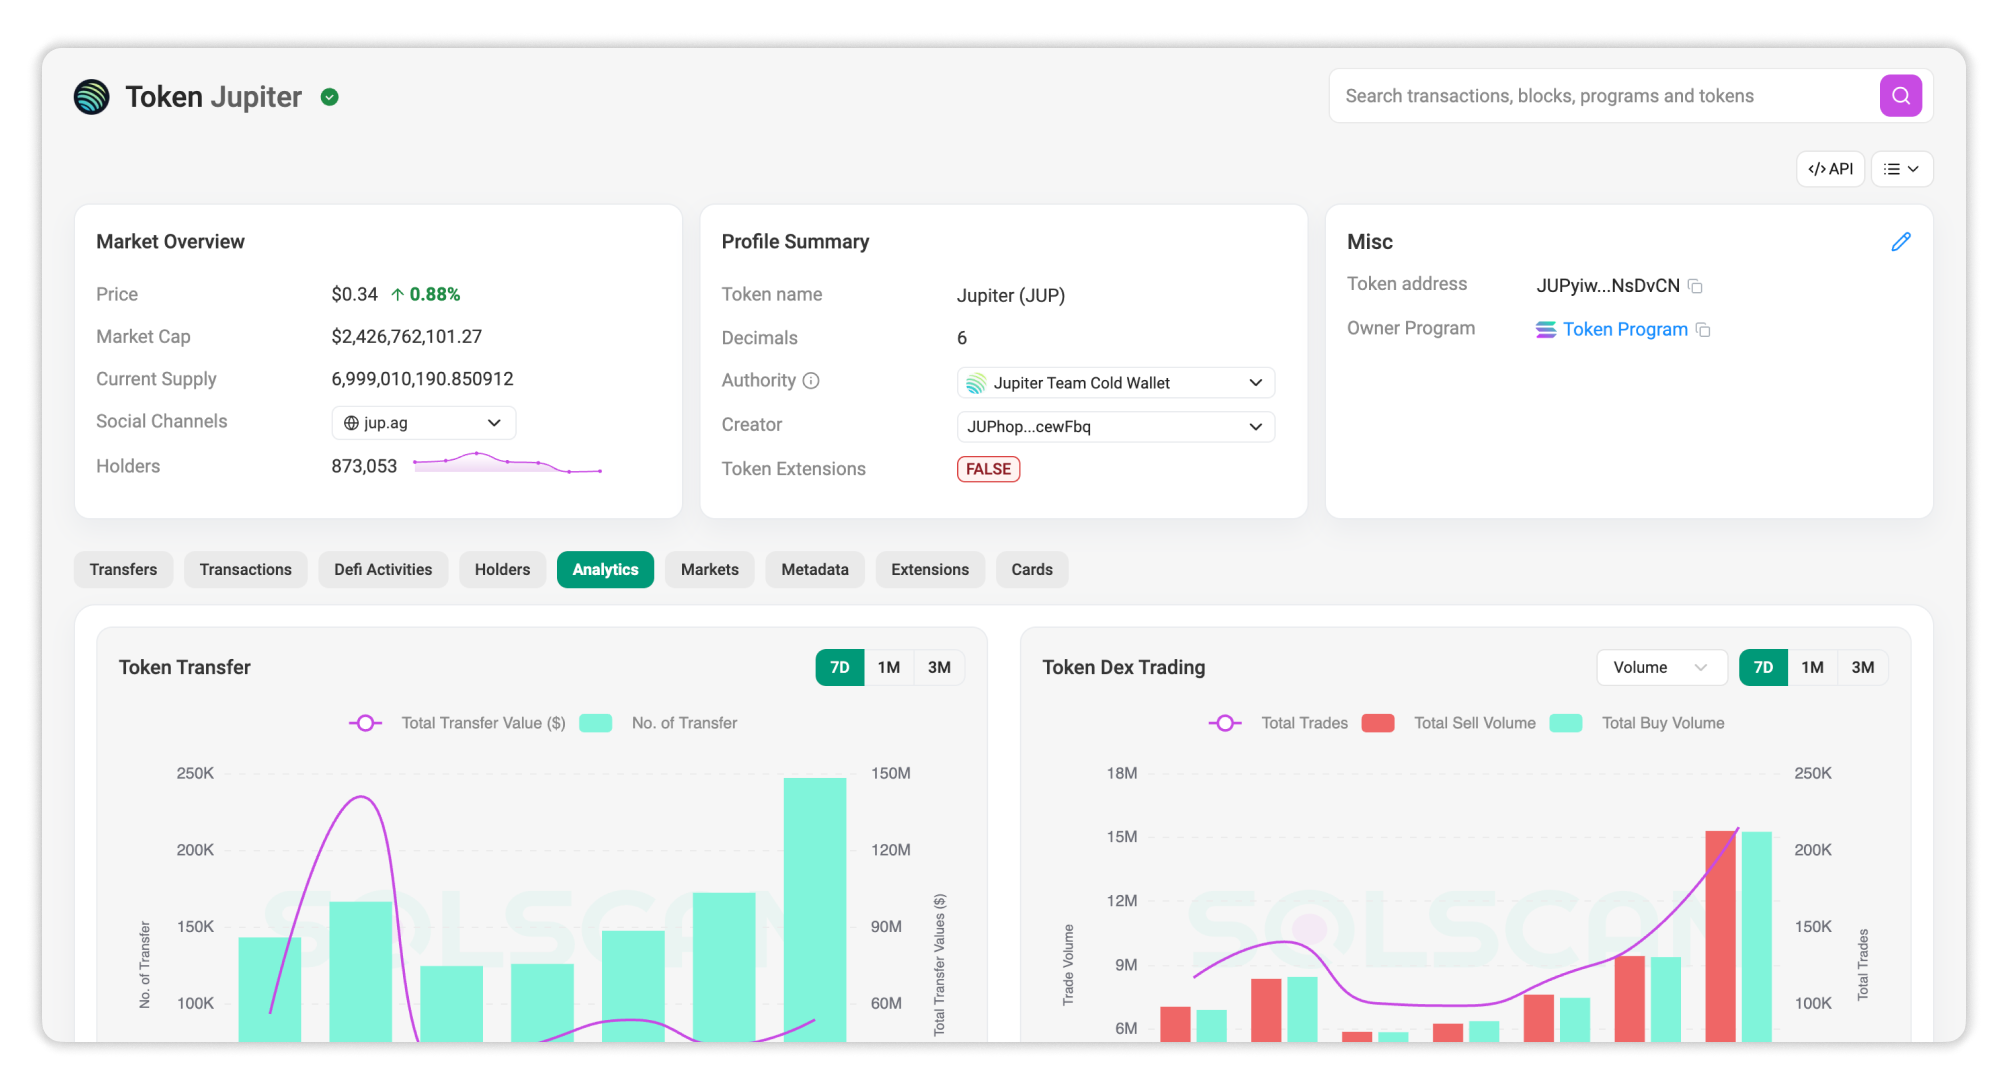
The Token Analytics feature gives you a deeper view into a token’s on-chain activity, holder behavior, and trading dynamics. Rather than simply viewing basic token details and transactions, this tab surfaces trends and insights that help both casual users and analysts understand how a token moves and performs on-chain.
How to Access
The Token Analytics tab is available on every Token page on Solscan.
- Navigate to the token’s detail page on Solscan by pasting the token address and selecting the right result in the search bar.
- Open the Analytics tab.
Within this tab, you’ll find a range of charts and metrics covering topics such as token holders, price, and transfer or trading activity.
Users can hover over data points for precise values, toggle chart legends to adjust the data range where applicable.
Charts & Insights
The Analytics tab includes several charts and metrics that capture different aspects of a token’s on-chain activity. For easier interpretation, these insights are grouped below by related topics.
Transfer & Trading Activity

- Token Transfer: Displays the total value and count of the token’s movements between wallets (excluding trading pairs) over time.
- Token DEX Trading: Displays the total volume and count of the token’s trading activities on DEX.

- Token Distribution by Value Transfer: Displays the transfer volumes divided by value range.
- Token Distribution by Value Swap: Displays the DEX swap volumes divided by value range.
Token Market Overview
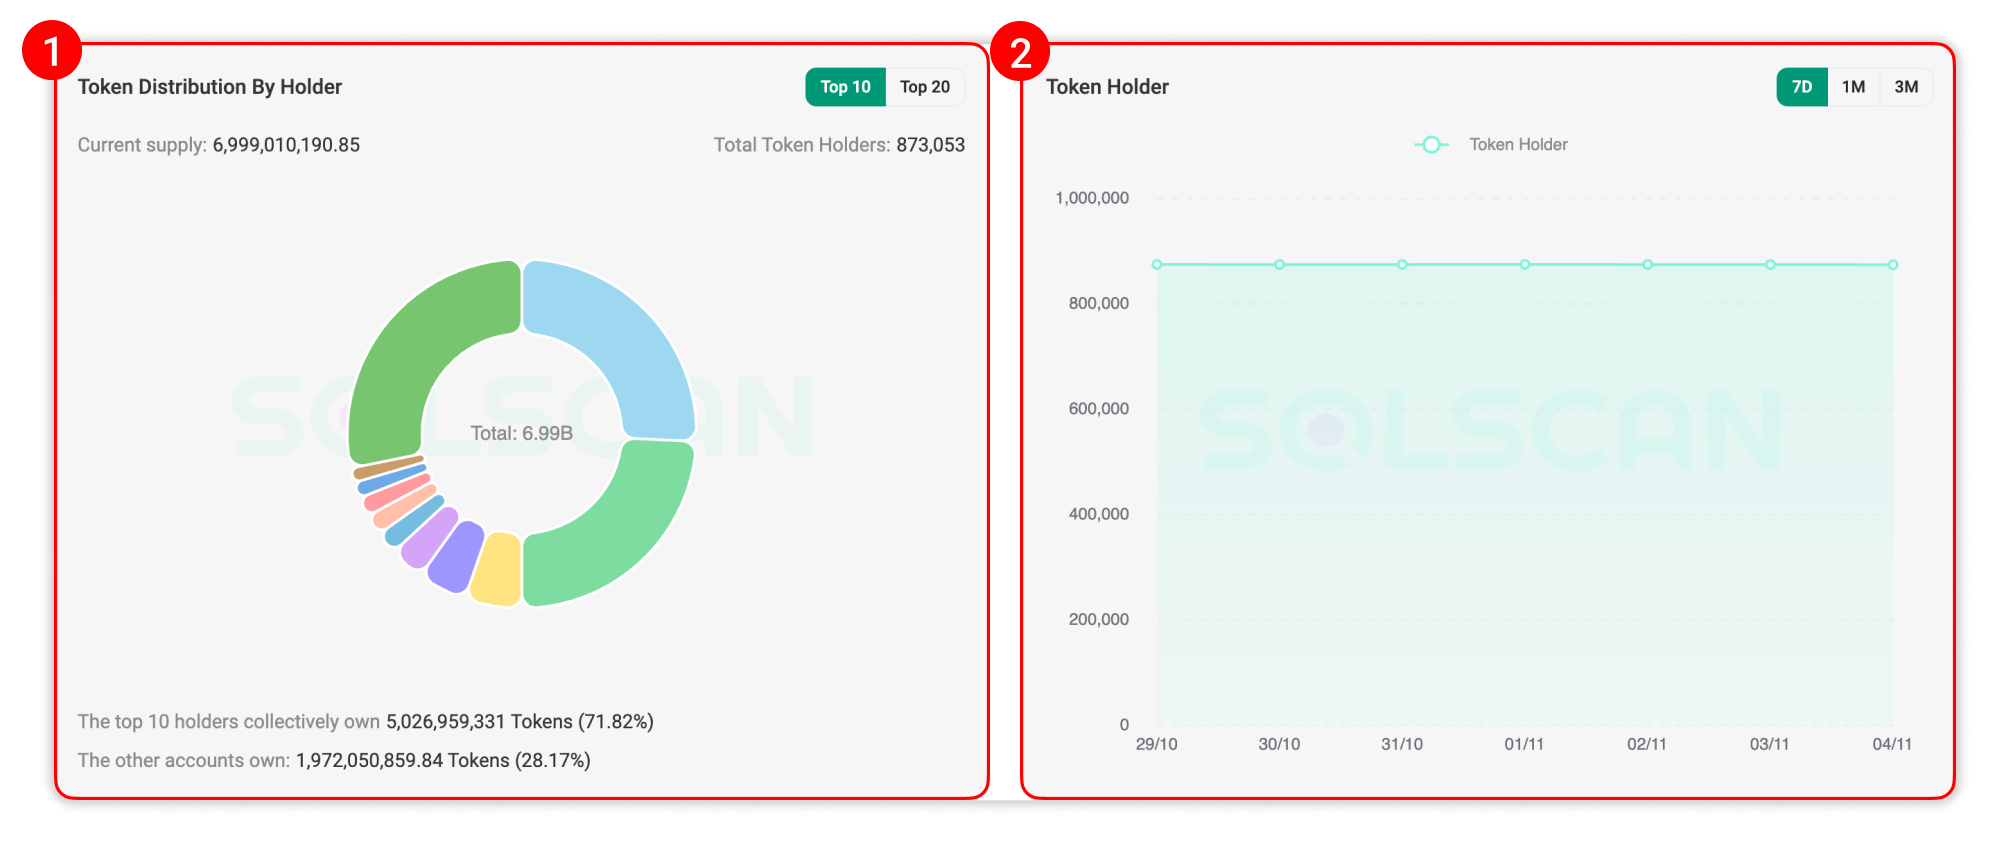
- Token Distribution by Holder: Displays the distribution of token holdings across wallets.
- Token Holder: Displays the number of token holders over time.
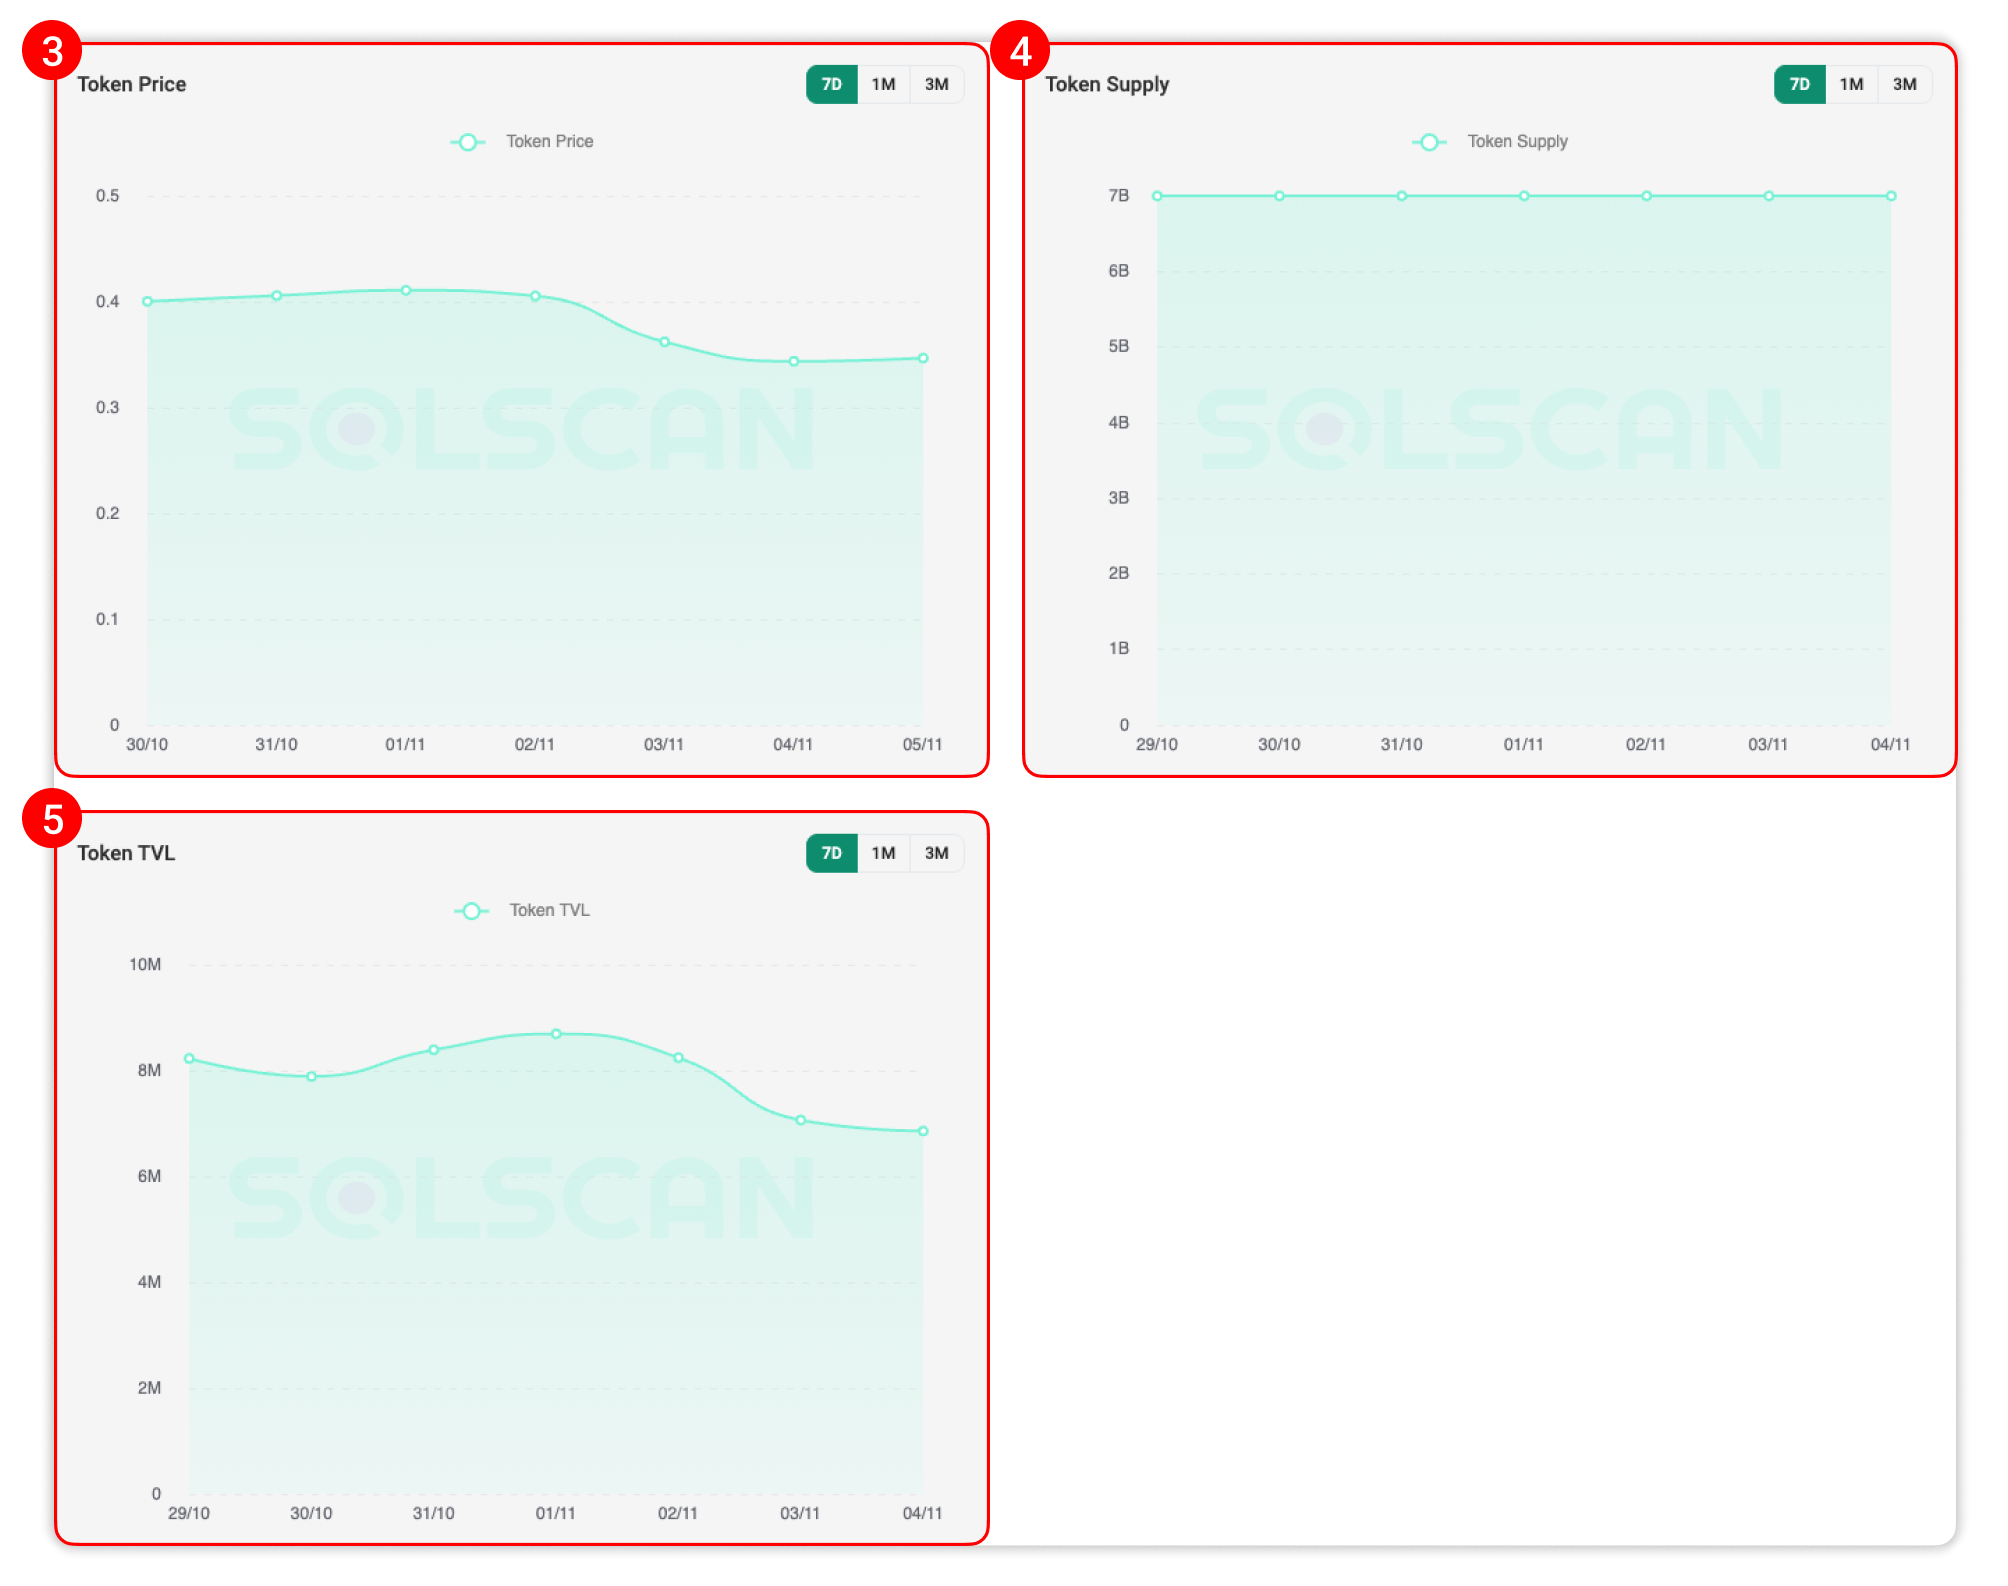
- Token Price: Displays the token’s price movement.
- Token Supply: Displays the token’s current supply.
- Token TVL: Displays the token’s total value locked.
Data Coverage
All analytics charts can be viewed over a selectable time range of past 7 days, 1 month, or 3 months. By default, the charts display the most recent 7 days of data, users can select the legend to expand this range.
All data visualizations are generated from indexed on-chain records and refreshed periodically to ensure they reflect the most recent on-chain activity.
Example Use Case
Suppose you want to analyze the on-chain performance of Bonk (BONK). By visiting the token’s page on Solscan and opening the Token Analytics tab, you can quickly review key metrics such as price movement, supply changes, trading volume, and holder distribution.
For instance, you might compare BONK’s daily trading activity with the growth of its holder base to understand how market sentiment shifts over time. Similarly, the DEX trading and transfer charts can help you evaluate whether trading remains active or is slowing down.
This approach can be applied to any other token to identify on-chain trends, track adoption, and assess token health, all without leaving Solscan.
Notes
Data shown in Token Analytics is for informational and educational purposes only. It does not constitute financial advice or investment recommendation. Tokens referenced in this article are used purely for illustration.