
Solscan Data Intelligence
Table of Contents
- Accessing the Dashboard
- Tokens
- Token Distribution by Lifecycle
- Token Classification - Programs
- Programs by Category
- List Programs
- Weekly and Monthly Active Programs - Accounts
- Accounts by Tags
- Accounts by Category
- Deposit Wallet Distribution
- Extra Tags by Group Tag
- Token by Reputation
- Accounts by Extra Tags
- Account Pools by Extra Tags - Funded By
- Annual Funding Activity
- Monthly and Cumulative Trends
- Top Funders of All Time
- Funding Activity Over the Last 30 Days
Solana’s scale makes it difficult to understand the ecosystem through individual transactions and accounts alone. The Solscan Data Intelligence Dashboard combines Solscan’s indexed and parsed onchain data with a labeling and tagging system that classifies tokens, programs, accounts, and funding relationships across the network.
Together, these datasets provide a broader view of Solana’s underlying structure: how tokens are classified, which types of programs are active, how accounts are labeled, and where accounts receive their initial funding.
Accessing the Dashboard
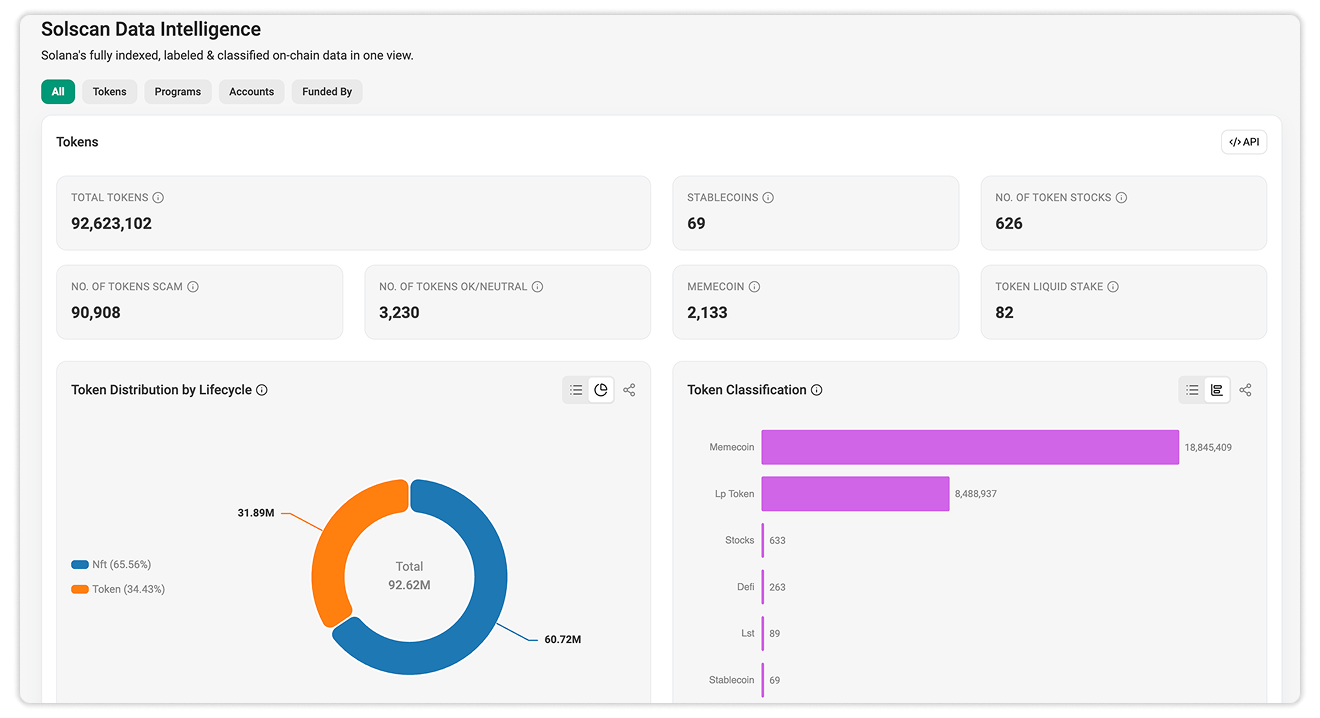
Bookmark the Solscan Data Intelligence Dashboard link, or open it from the Analytics dropdown on the Solscan homepage by selecting Analytics > Solscan Data Intelligence.
Five tabs organize the available data: All, Tokens, Programs, Accounts, and Funded By. Select a specific tab to examine one area, or select All to view the Tokens, Programs, and Accounts sections on a single page.
Charts and tables include interactive controls for switching between supported views, navigating results, and opening related accounts, programs, tags, or categories on Solscan. Selected datasets also provide API access for further analysis or integration into external applications.
Tokens
The Tokens section provides a network-wide overview of the tokens indexed and classified by Solscan.
Its summary metrics include:

Together, these metrics show the overall scale of token creation on Solana and the number of assets identified under several classifications. These classifications are based on Solscan’s indexed token data, labeling system, and available token metadata.
Token Distribution by Lifecycle
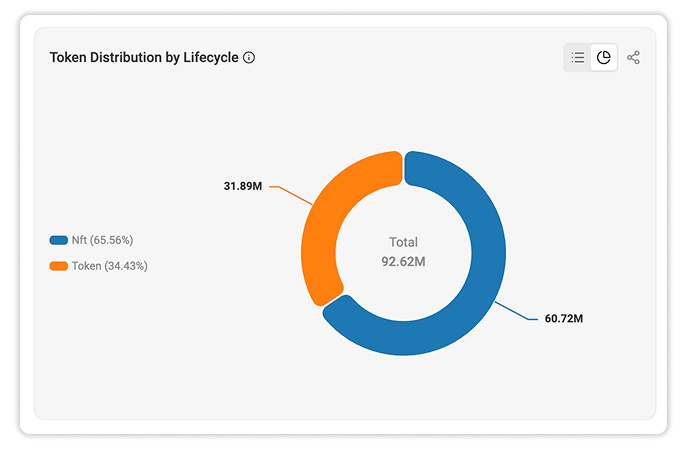
The Token Distribution by Lifecycle chart visualizes the total number of indexed tokens on Solana and divides them into two categories: fungible tokens and NFTs.
Token Classification
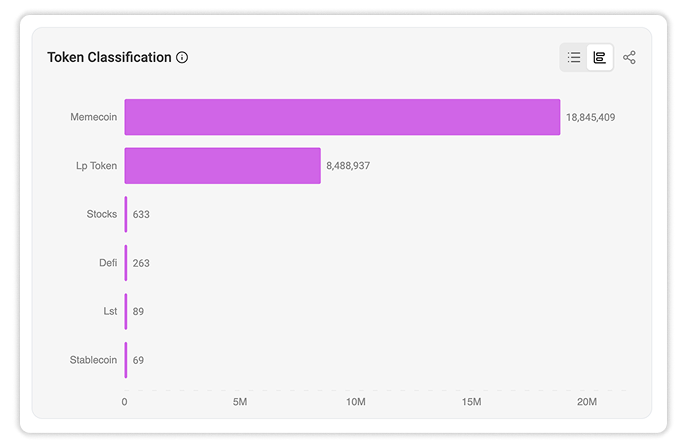
The Token Classification chart shows the number of tokens assigned to each major classification.
This view provides more context around the total token count and makes it easier to compare the relative scale of major token groups within the Solana ecosystem.
Programs
Programs are executable accounts that power applications and onchain operations on Solana. The Programs section provides an overview of Solscan’s indexed program dataset, enriched with labels and functional categories where available.
Its summary metrics include:
- Total programs: Total onchain programs deployed on Solana
- Active programs with labels: Active programs associated with a known label or entity
- Number of program arbitrage bots: Programs classified as arbitrage or sandwich bots
- Number of program swaps: Programs classified as swap or DEX programs

Together, these metrics show the scale of Solana’s program infrastructure and the contextual information available for identifying active and specialized programs.
Programs by Category
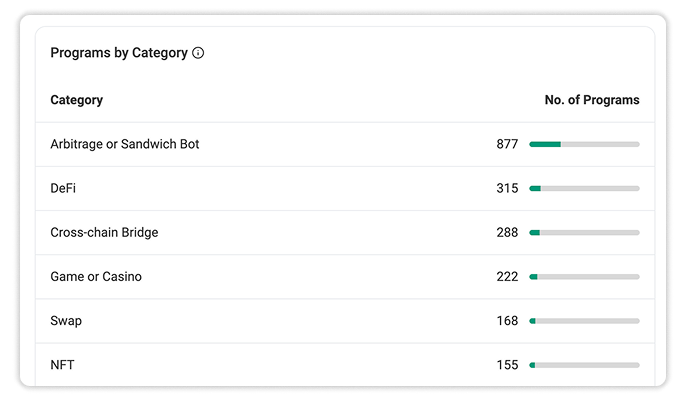
The Programs by Category table groups identified programs according to their primary function. Categories include DeFi, swaps, NFTs, and several other types of onchain applications and infrastructure.
The table makes it easier to compare the number of identified programs operating across different parts of the ecosystem.
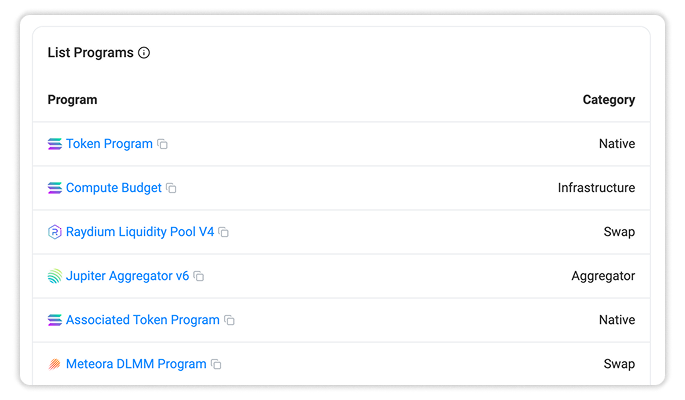
List Programs
The List Programs table displays individual programs together with their assigned categories.
Each program name links to its corresponding Solscan program page, allowing users to move from the ecosystem-level overview to detailed onchain information.
Weekly and Monthly Active Programs
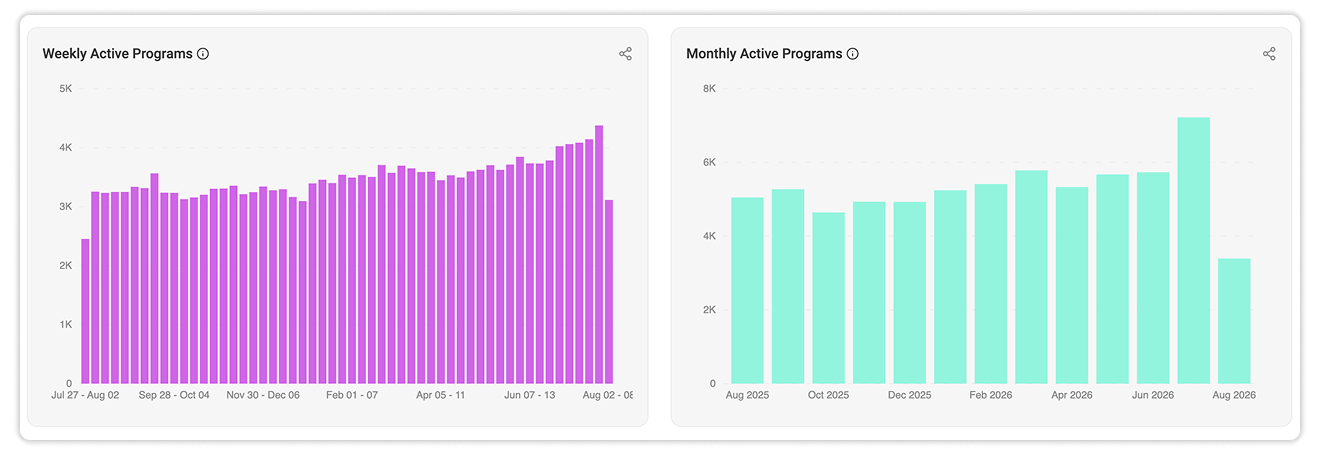
The activity charts track active programs across weekly and monthly periods:
- Weekly Active Programs counts programs that recorded at least one transaction during a given week.
- Monthly Active Programs counts programs that recorded at least one transaction during a given month.
Viewed together, these charts show how the number of active programs has changed over the past year.
Accounts
The Accounts section examines the scale and composition of Solscan’s labeled account dataset.
Its headline metrics include:
- Total accounts with labels: Accounts assigned at least one label
- Total labels: Labels assigned across all accounts; one account may have multiple labels
- Total spam accounts: Accounts flagged as spam
- Unique accounts active within the last 24 hours
- Unique accounts active within the last seven days
- Total token creators across all tokens: Accounts that have created at least one token
The distinction between labeled accounts and total labels is important because one account can carry multiple labels. These metrics show both the number of accounts covered by Solscan’s labeling system and the amount of contextual data assigned across them.

Accounts by Tags
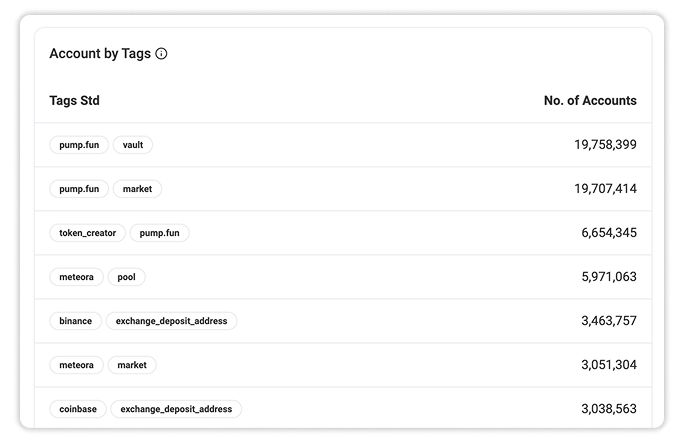
The Account by Tags table shows the most widely assigned combinations of Solscan tags and the number of accounts associated with each combination.
These tags provide specific context about an account’s relationship to a protocol, exchange, market, pool, token creator, or other identifiable entity or activity.
For example, an account may carry both a platform tag and a functional tag, such as an exchange name combined with Deposit Address, or a protocol name combined with Vault, Market, or Pool.
Accounts by Category
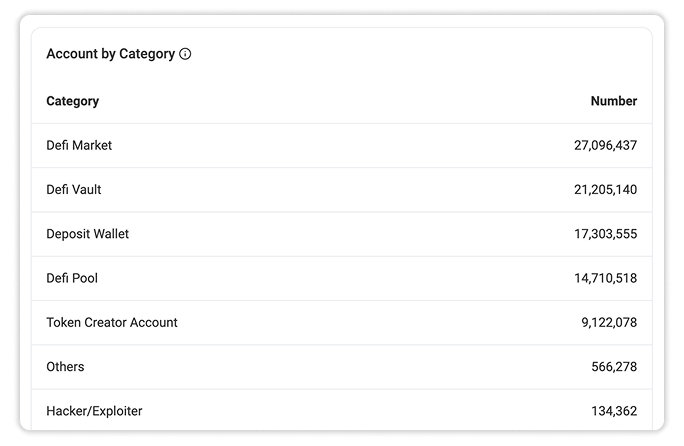
The Account by Category table organizes labeled accounts into broader functional categories, including DeFi Market, DeFi Vault, Deposit Wallet, and Validator, among others.
While tags describe specific account-level attributes or relationships, categories group accounts according to their broader roles within the ecosystem.
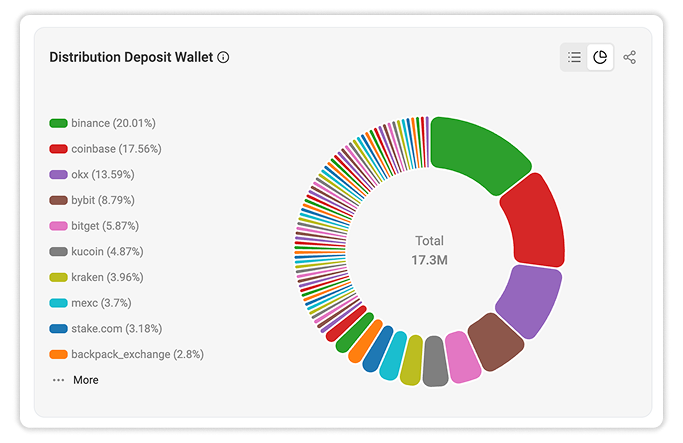
Deposit Wallet Distribution
The Distribution Deposit Wallet chart shows how labeled deposit wallets are distributed across supported centralized exchanges and custodial platforms.
A deposit wallet is an address assigned to receive assets on behalf of an exchange user. Mapping these addresses helps distinguish exchange-related transfers from other account activity and provides a clearer view of custodial infrastructure on Solana.
The chart allows users to compare each supported exchange’s share of labeled deposit wallets.
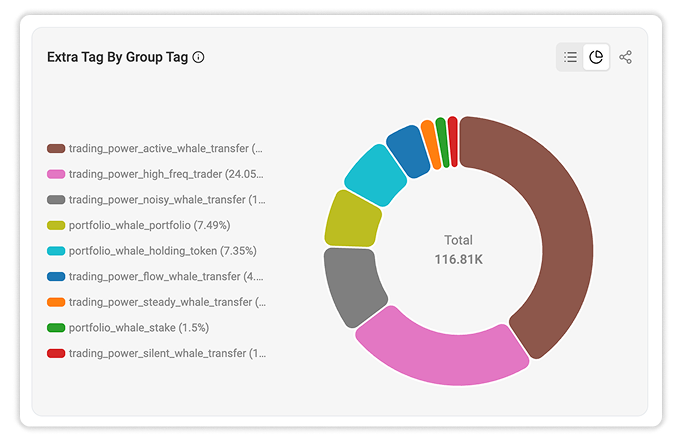
Extra Tags by Group Tag
The Extra Tag by Group Tag chart shows how individual Solscan extra tags are distributed across their parent tag groups.
Examples include tags related to pool creators, active traders, token creators, and whale transfers. This structure connects detailed behavioral or functional tags with the broader groups used to organize them.
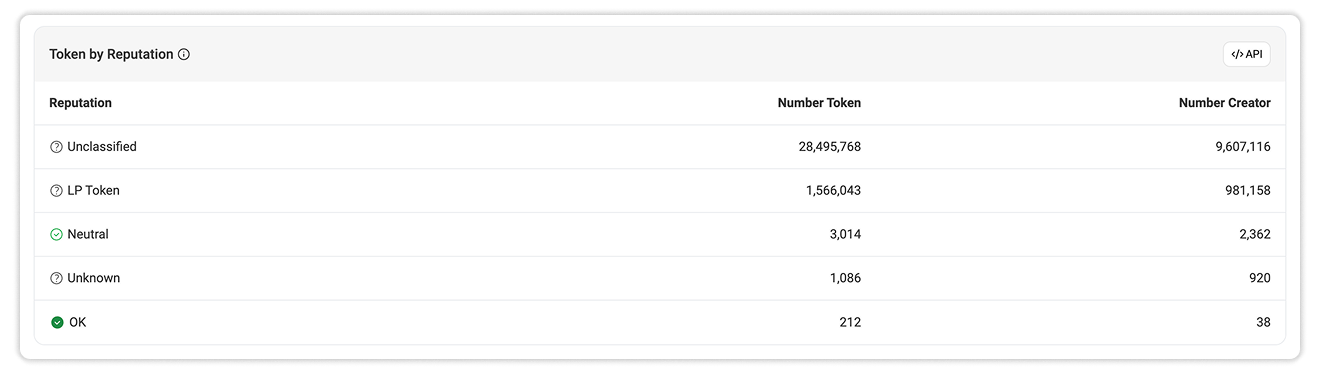
Token by Reputation
The Token by Reputation table groups tokens and their creators according to Solscan Token Reputation.
For each reputation classification, the table displays the number of tokens and the number of creators.
This comparison shows how tokens and their creators are distributed across Solscan’s reputation classifications.
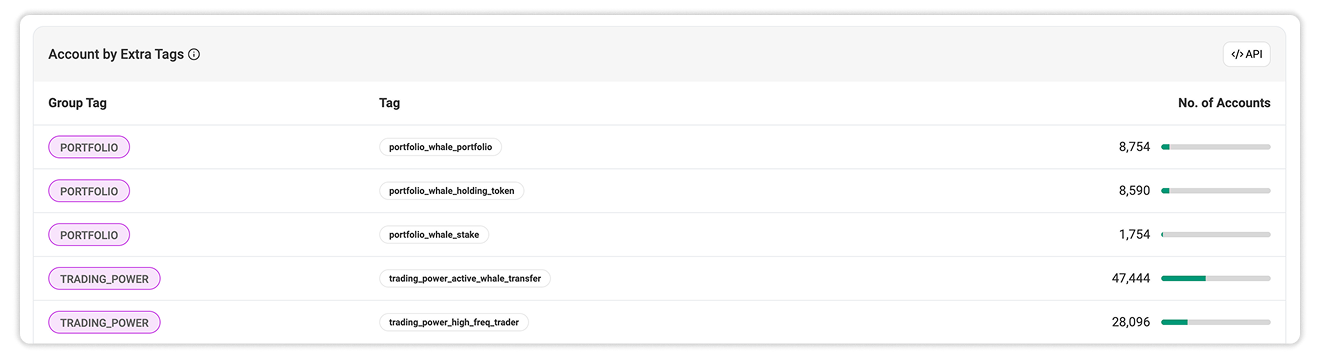
Accounts by Extra Tags
The Account by Extra Tags table lists specific extra tags, their parent group tags, and the number of associated accounts.
Group tags shown in the dashboard include Builder, Portfolio, Security, and Trading Power. Related extra tags provide more granular classifications. For more details, see Solscan Extra Tags.
Account Pools by Extra Tags
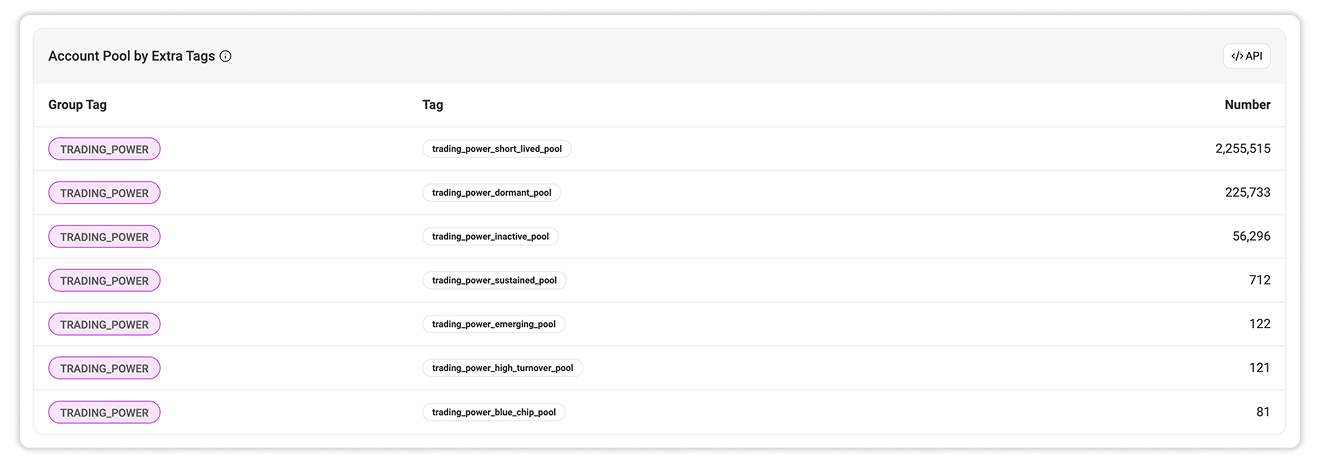
The Account Pool by Extra Tags table focuses on pool accounts classified under the Trading Power group.
It includes tags for different pool activity patterns such as Short-lived pools, Dormant pools, Inactive pools, etc.
These tags provide a structured view of pool behavior based on activity patterns identified by Solscan.
Funded By
The Funded By section analyzes the first recorded funding relationships between Solana accounts using Solscan’s indexed transaction data.
When an account receives its initial SOL funding, Solscan identifies the source account as its funder. Aggregating these relationships provides a network-wide view of how accounts are initially funded and which sources are responsible.
The section begins with three metrics:
- Total funded accounts: Accounts that have received initial funding
- Total funders: Distinct accounts that have funded other accounts
- Total funding volume: Cumulative SOL transferred through initial funding transactions

Annual Funding Activity
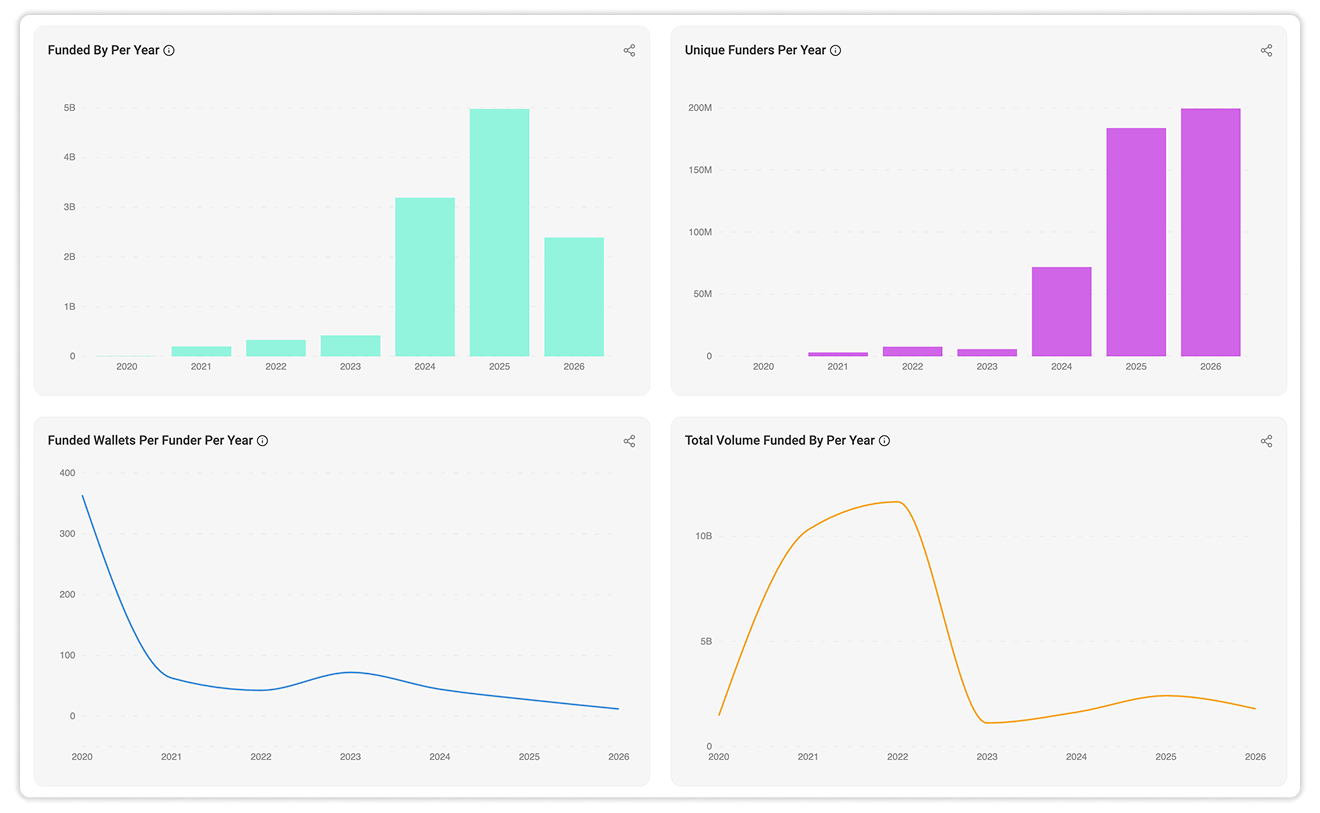
Four charts provide yearly views of funding activity:
- Funded By Per Year: Number of accounts funded during each year
- Unique Funders Per Year: Number of distinct funding accounts recorded during each year
- Funded Wallets Per Funder Per Year: Average number of accounts funded by each funder
- Total Volume Funded By Per Year: Total SOL transferred through initial funding transactions during each year
Viewed together, these charts distinguish changes in funded-account counts from changes in the number of funding sources and the amount of SOL transferred.
Monthly and Cumulative Trends
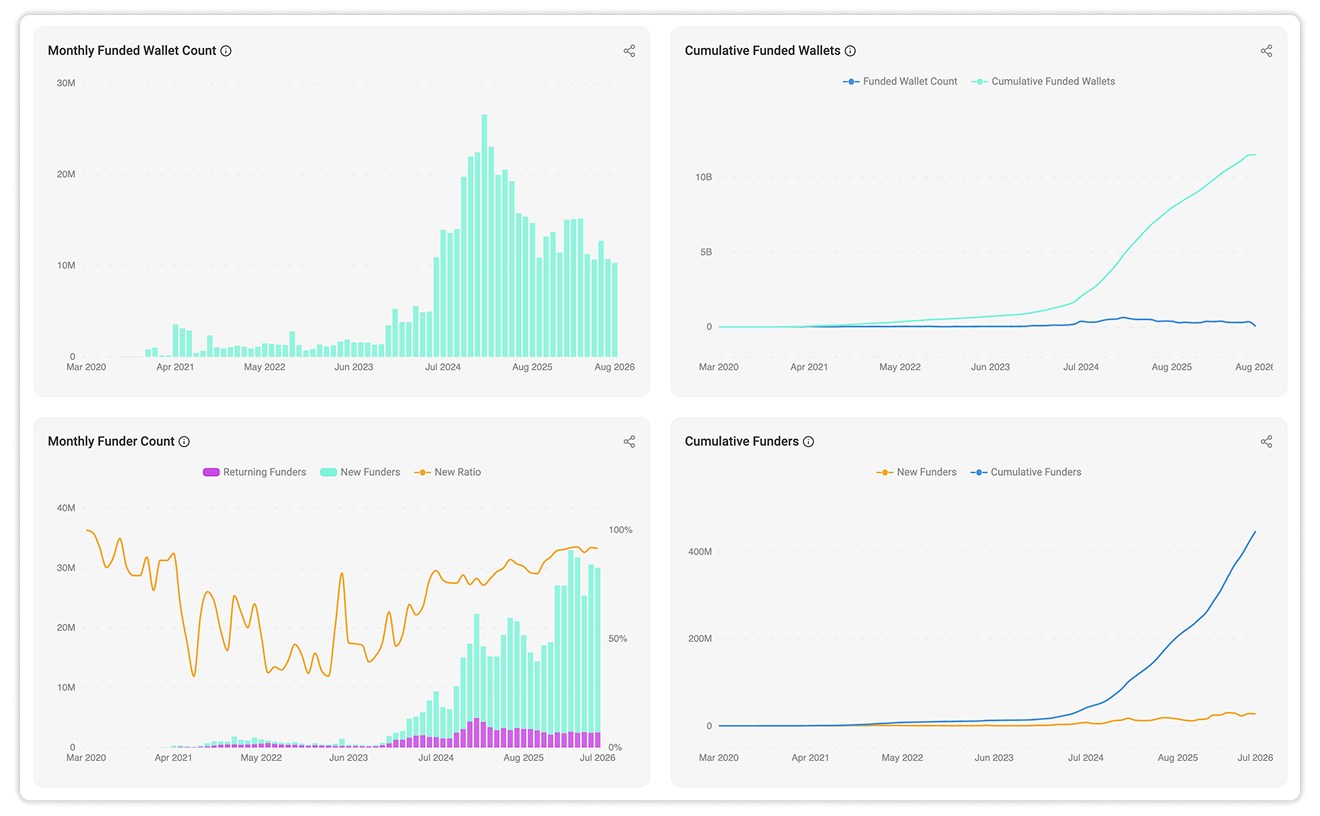
The monthly and cumulative charts provide a more detailed timeline:
- Monthly Funded Wallet Count tracks the number of funded accounts recorded each month.
- Cumulative Funded Wallets compares the monthly count with the cumulative total.
- Monthly Funder Count separates new funders from returning funders and displays the ratio of new funders.
- Cumulative Funders compares new funders with the cumulative number of funders over time.
These views show how funding activity has developed and whether changes were driven by new or returning funders.
Top Funders of All Time
The dashboard provides two all-time rankings:
- Top 100 Funders by Wallet All Time: Accounts ranked by the number of accounts funded
- Top 100 Funders by Volume All Time: Accounts ranked by total funding volume
Each table displays the funder, funded-account count, and total funding volume.
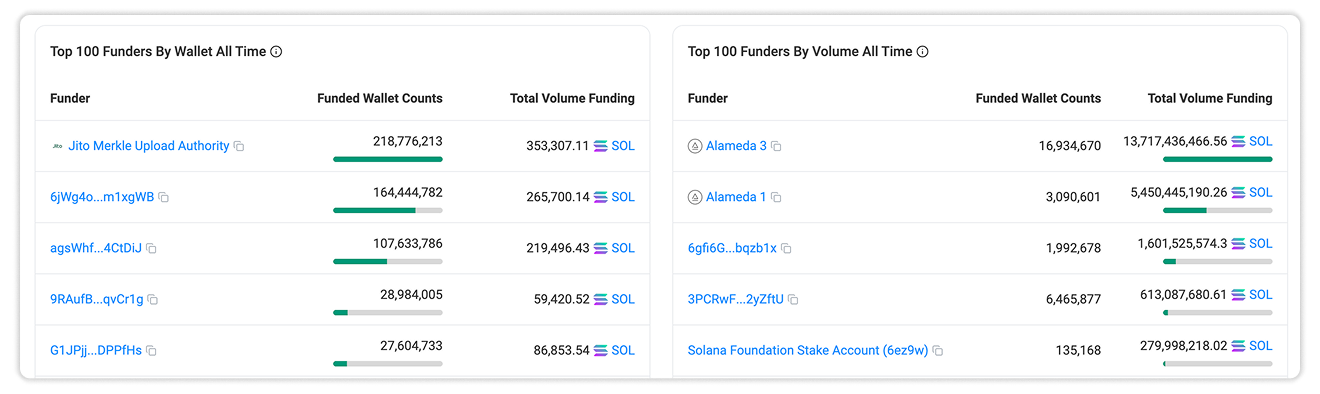
These rankings distinguish accounts that fund large numbers of accounts from those that transfer the largest amounts of SOL. A funder may rank highly by account count without ranking equally highly by volume, and vice versa.
Program-controlled accounts, infrastructure services, exchanges, and other high-volume entities may appear in these rankings. The data represents onchain funding relationships and does not necessarily indicate direct relationships between individual users.
Funding Activity Over the Last 30 Days
The final part of the dashboard focuses on activity recorded during the latest 30-day period.
Its summary metrics include:

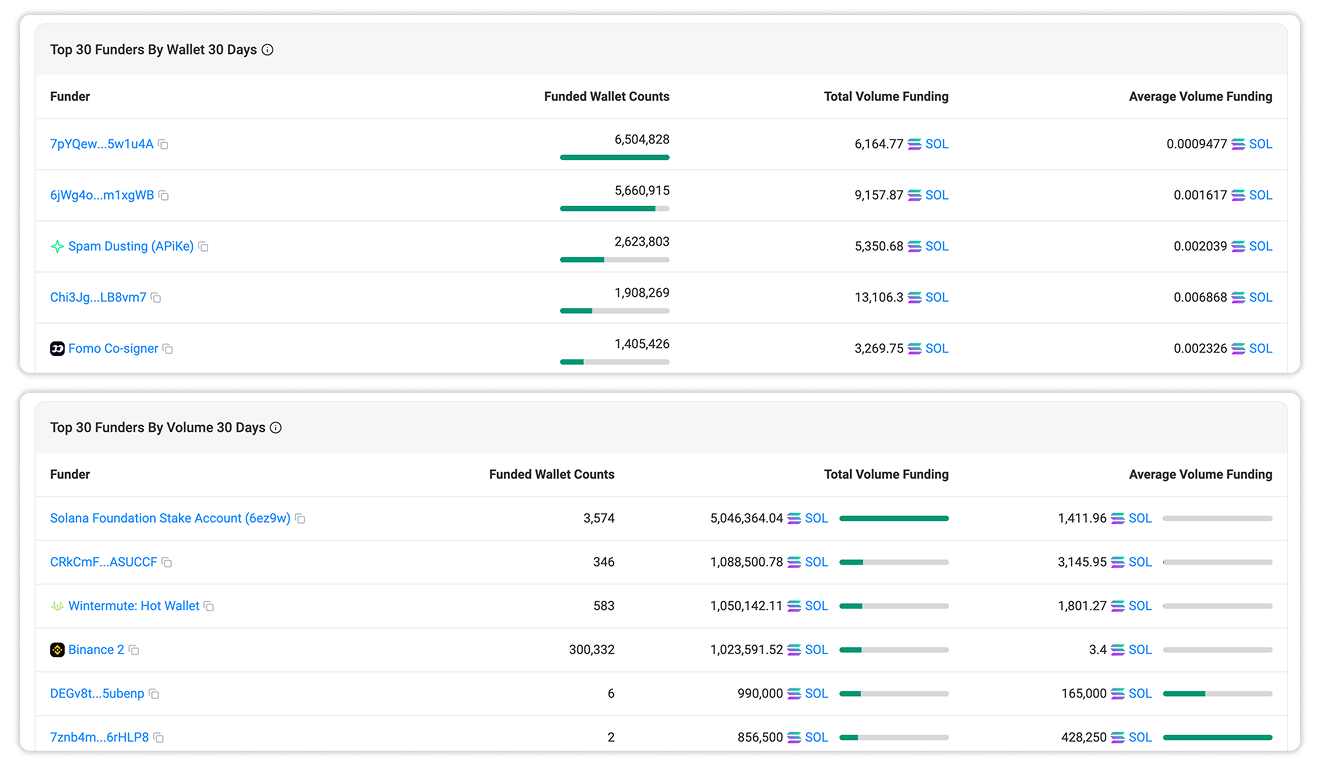
Two additional tables rank recent funders:
- Top 30 Funders by Wallet 30 Days: Ranked by funded-account count
- Top 30 Funders by Volume 30 Days: Ranked by total funding volume
Both tables include the funder, funded-account count, total funding volume, and average funding volume. Together, they identify the accounts with the largest recent funding activity by scale and transferred value.

Still Have Questions?
Supported Explorers
 Solscan
  Eclipsescan
  Fogoscan