Solscan Token Holder Analytics
Table of Contents
- What Token Holder Analytics Helps Users Understand
- Header Metrics
- Top 10 Holders Concentration
- Token Whale Concentration
- Portfolio Whale Concentration - Holder Concentration
- Wallet Depth by Threshold
- Holder Distribution by Tier
- Holder Distribution by Tag
- Token Holder Trend
- Example Analysis Workflows
- Conclusion
Solscan has introduced Token Holder Analytics on token pages, giving users a deeper view of how a token is distributed across its holders.
In addition to the holder list, users can now analyze concentration, whale exposure, wallet depth, holder tiers, wallet tags, and holder growth over time, all within a single analytics view for evaluating ownership structure and distribution more efficiently.
This makes the Token Holders page a stronger tool for token research, risk assessment, and on-chain analysis.
What Token Holder Analytics Helps Users Understand
Token holder data can answer more than “who holds this token?” The new holder analytics dashboard helps users evaluate holder concentration, whale participation, ownership distribution, and wallet composition.
Users can also track holder growth over time and identify the types of wallets holding a token. Together, these insights provide a clearer view of token ownership for research, risk assessment, market monitoring, and on-chain due diligence.
Header Metrics
At the top of the Token Holder Analytics dashboard, Solscan displays three headline metrics:
Top 10 Holders Concentration
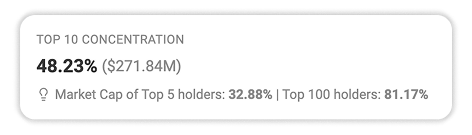
Top 10 Holders Concentration shows how much of the token’s market cap, by percentage and value, is held by the first 10 wallets in the holder list compared with the rest of the holders. Solscan also provides concentration insights for the Top 5 and Top 100 holders.
A higher percentage means a larger share of the token’s value is held by top wallets, while a lower percentage indicates ownership is distributed across a broader set of holders.
High concentration can increase the influence of large wallets on token activity and price movement. However, users should also review wallet labels and holder details, as top holders may include exchanges, liquidity pools, treasury wallets, or other ecosystem-related addresses rather than individual investors.
Token Whale Concentration
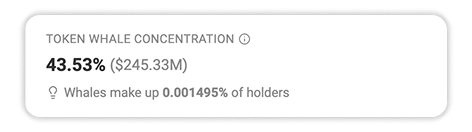
Token Whale Concentration shows the portion of holders that each hold more than $1M worth of the selected token. This metric only considers the value of the selected token held by each wallet.
If a token has many token whales, it indicates that a meaningful share of its value is held by large holders. This can be an important signal when evaluating market structure, as whale activity may have a greater impact on liquidity, price movement, and potential sell pressure. Conversely, a token with few or no token whales may have a more broadly distributed holder base or lower participation from large-capital wallets.
Portfolio Whale Concentration
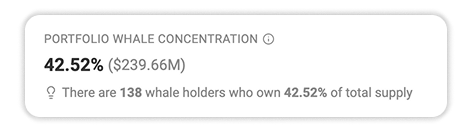
Portfolio Whale Concentration shows the portion of holders whose total wallet balance exceeds $1M across any token, regardless of how much of the selected token they hold. Unlike Token Whale Concentration, which measures holders with more than $1M worth of the selected token, Portfolio Whale Concentration identifies wallets that are whales based on their overall on-chain portfolio value.
A wallet can qualify as a portfolio whale without being a token whale. For example, a wallet holding $5M in total assets but only $5,000 of the selected token would be counted in Portfolio Whale Concentration, but not in Token Whale Concentration.
Portfolio Whale Concentration helps users understand who is holding the token, not just how much of the token they hold. However, this does not necessarily mean those wallets have a large position in the selected token, so users should compare this metric with Token Whale Concentration to determine whether these whales are meaningfully exposed to the token.
Holder Concentration
The Holder Concentration section visualizes how token value is distributed across ranked holder groups using pie chart and bar chart views. Holder groups are segmented by ranking ranges.
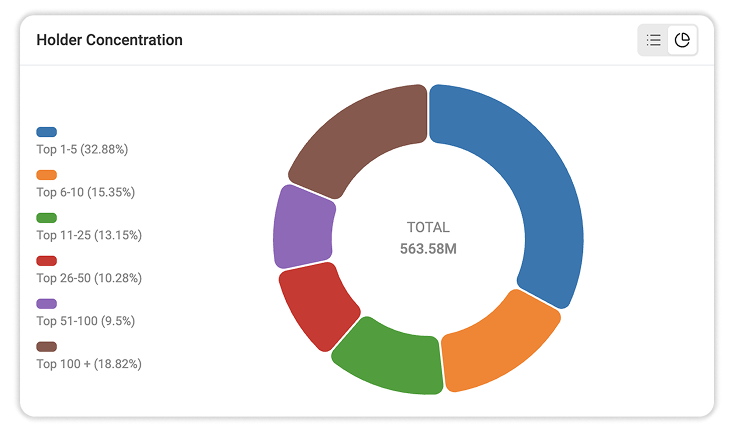
Instead of reviewing individual wallet balances, these charts aggregate holders by rank and show how much of the token’s value each group controls. This makes the overall ownership structure easier to read at a glance.
Holder Concentration helps users understand whether ownership is concentrated among a small number of top wallets or more broadly distributed across the holder base. While a holder list shows individual balances, it can be difficult to assess the broader ownership structure from addresses alone. By grouping holders and visualizing their share of token value, Holder Concentration makes it easier to identify whether the largest wallets control a significant portion of supply.
Wallet Depth by Threshold
The Wallet Depth by Threshold section displays a bar chart that groups holders by the value of the selected token they hold, showing how many wallets fall within each value range.
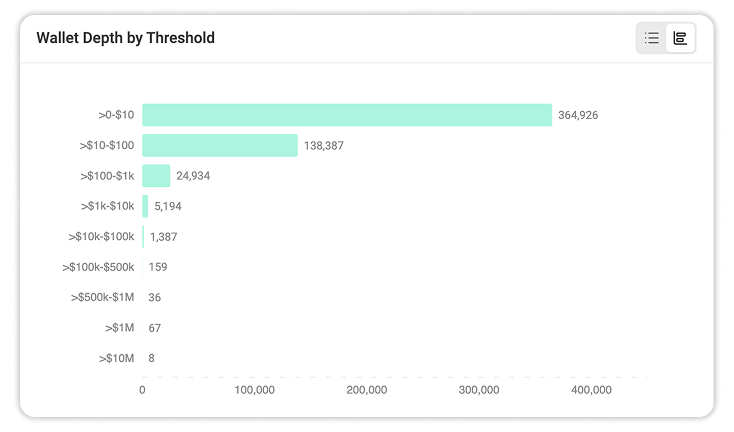
By visualizing holder counts across these thresholds in one graph, users can quickly assess whether the token is mainly held by small-balance wallets, mid-sized holders, or larger holders. This provides a clearer view of holder depth beyond total holder count.
For example, a token may have many holders overall, but the chart may show that most hold less than $10 worth of the token. Another token may have fewer holders but stronger participation across higher-value ranges.
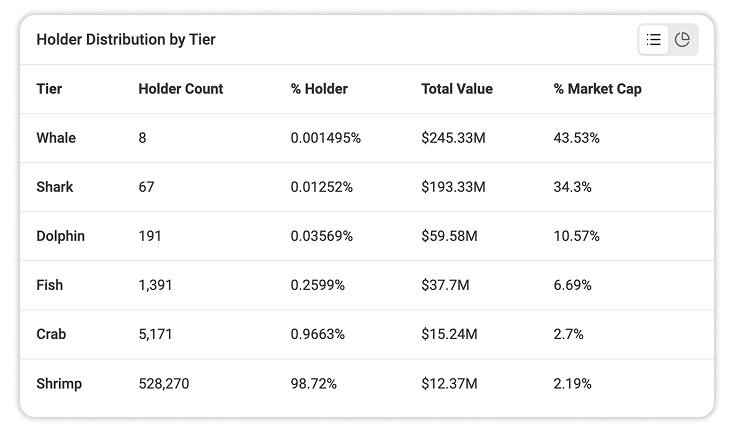
Holder Distribution by Tier
Holder Distribution by Tier groups holders based on their wallet portfolio value, excluding the value of the selected token. It reflects the holder’s broader financial profile rather than the value of their position in that token.
Holders are classified as Whale (≥ $1M), Shark ($100K–$1M), Dolphin ($10K–$100K), Fish ($1K–$10K), Crab ($100–$1K), or Shrimp (< $100).
For example, a Token A holder is classified as a Whale only if their wallet still holds at least $1 million in other assets after Token A is excluded.
The dashboard also shows the number of holders in each tier, the selected token value they collectively hold, and their share of the token’s market cap.
Holder Distribution by Tag
The Holder Distribution by Tag section groups holders based on Solscan Extra Tags, providing additional context about the types of wallets holding a token. Rather than treating every holder as an anonymous address, Solscan categorizes tagged wallets into groups such as Whale, Active Trader, and Creator, helping users better understand holder composition.
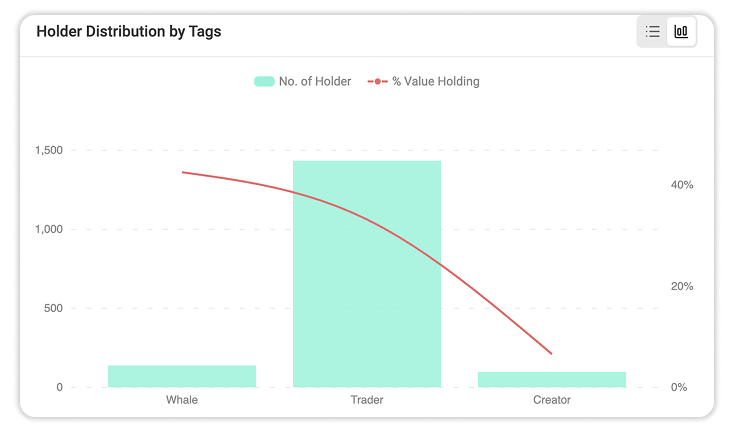
For example:
- A token with many trader-tagged wallets may have a more active trading-oriented holder base.
- A token with creator-tagged wallets may require users to review creator or project-related holdings.
- A token with whale-tagged wallets may have stronger large-wallet presence.
Token Holder Trend
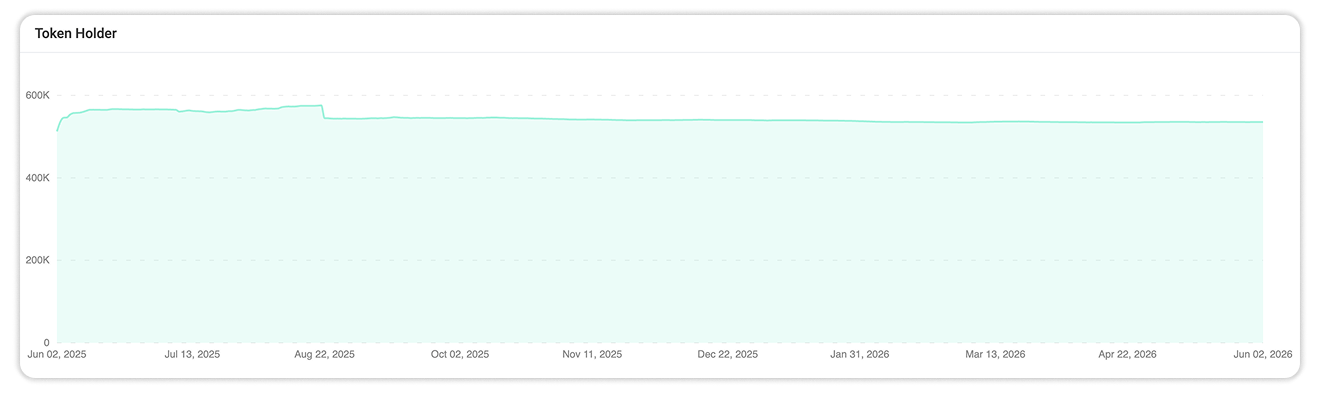
The Token Holder Trend section tracks the daily number of token holders over time, with up to one year of historical data available. By visualizing holder count changes in a single chart, users can quickly identify growth, decline, or periods of stability and gain historical context beyond the current holder count.
However, holder count should not be interpreted alone. A token can gain many new holders with very small balances, or lose small holders while retaining high-value holders.
Example Analysis Workflows
- Concentration risk: Start with Top 10 Holders Concentration, then review Holder Concentration to see how much value is controlled by the largest wallet groups.
- Whale exposure: Compare Token Whale Concentration and Portfolio Whale Concentration to distinguish token-specific whales from generally wealthy wallets.
- Holder depth: Use Wallet Depth by Threshold and Holder Distribution by Tier to assess whether holder count is supported by meaningful balances.
- Holder growth: Review Token Holder Trend alongside holder depth and tier data to understand how the holder base is evolving over time.
Conclusion
The Token Holder Analytics dashboard gives Solscan users a deeper view of token ownership by combining concentration, whale exposure, wallet depth, holder tiers, wallet tags, and holder growth in one place. These insights help users better evaluate token distribution, holder quality, and potential risks when conducting token research and on-chain analysis.